High-fidelity, zero-delay analytical indicators designed for NinjaTrader 8.
Interactive visualization of the Atlas indicator suite overlays on `/atlas_chart_master.jpg`. Hover over pins or select cards to view telemetry details.
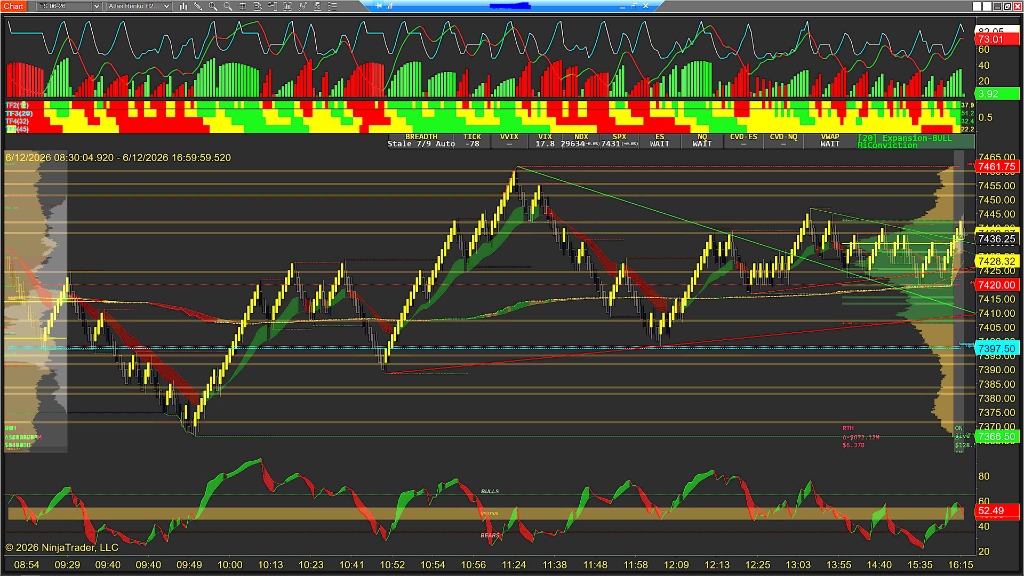
Atlas replaces conventional lagging indicators with recursive Bayesian state estimators and real-time order-book analytics to provide clear directional conviction. Hover over any pin on the map or card below to view its details.
Acts as the ultimate institutional volume anchor. Replaces lagging moving averages with a dynamic, real-time value band that filters market noise and maps high-conviction support/resistance zones before retail charts react.
A multi-scaled regime classifier that continuously scans 4 timeframes simultaneously. Instantly isolates rotational range chop and compression, signaling high-probability expansion phases so you only trade when the trend is real.
Synchronizes slope stability vectors across 4 distinct Renko frames to deliver pure trend acceleration. Eliminates false momentum traps, providing institutional-grade validation for high-conviction entries.
A high-performance breakout engine that measures coaxial volatility compression. Pinpoints the exact microsecond energy coils before explosive breakout expansion occurs, capturing maximum momentum runs.
Tracks real-time relative oscillatory swings based on horizontal auction density. Pinpoints precise exhaustions and structural turning points ahead of the crowd, matching professional tape-reading setups.
Resolves adaptive support/resistance zones by calculating local price variance clustering nodes. Maps critical horizontal auction reaction levels and dynamic breakout target grids with mathematical precision.
An advanced, lag-free predictive filter that anchors volume-weighted price distributions to key session events. Anticipates price levels and institutional defense zones ahead of time, outperforming standard indicators.
Monitors real-time transaction speed and block order flow to calculate true buying/selling pressure imbalance. Exposes institutional absorption and retail exhaustion points before they appear on the chart.
Measures volume density spikes across narrow price ranges. Reveals dynamic liquidity strains and tracks high-probability auction value areas (VAH/VAL) where institutional size is accumulating.
Continuously tracks the single price level with the highest transacted volume of the session. Acts as a powerful gravitational target and high-probability rotational mean-reversion level for professional scalp targets.
The 6 consecutive analysis and evaluation phases of a trade lifecycle.
Before evaluating any entries, the system identifies the structural regime. Traditional oscillators and moving averages generate late, lag-prone signals and fail inside range-bound chop. The Trend Ribbons track slope stability and momentum alignment simultaneously across 4 distinct Renko frames (TF2 to TF5) to prevent buying the top of a slow-grind range.
Combines dynamic slope mapping with custom-smoothed Ultimate Oscillator matrices. Evaluates trend strength independently of trend direction to isolate rotational chop and block entries in range-bound environments.
With trend regime established, the AAPF maps dynamic price boundaries. Traditional moving averages (SMA/EMA) lag behind price action, producing poor entries and delayed stop resets. The AAPF acts as a lag-free recursive Bayesian state estimator that smooths price action instantly by adapting to live transacted volume, projecting clear noise-free support/resistance zones.
Replaces static period-smoothing with dynamic state-space equations. Continually updates process noise matrices using price variance and transacted volume, mapping true price channels in real time.
Next, we verify where institutional capital is concentrated. Conventional support and resistance lines are arbitrary drawing tools. The Volume Profile calculates session-wide transaction density to map Developing Value Areas (VAH/VAL) and the Point of Control (POC). This locates exact coordinates where institutions consolidate and distribute inventory.
Tracks dynamic volume distributions rather than price action alone. Highlights high-probability target boundaries, Low Volume Nodes (LVN) velocity zones, and intraday anchor points for execution confirmation.
We then check price velocity to isolate true trend momentum from temporary range rotation. Standard MACD and RSI modules trigger late buy/sell signals that trap retail traders at major exhaustion levels. The Impulse MACD monitors trend velocity and detects regular/hidden divergences, allowing you to catch trend acceleration early while identifying when moves are losing steam.
Replaces simple exponential calculations with Wilder-smoothed velocity vectors. Calculates price acceleration rate relative to cyclical volatility to identify directional momentum before price action moves.
We monitor volatility compression to anticipate major breakouts. Volatility is cyclical, moving between contraction and expansion. The Volatility Explosion Engine uses coaxial Bollinger-Keltner channels to detect tight compression squeezes. It flags volatility release before explosive expansion occurs, helping you enter early and avoid false retail breakout traps.
Tracks visual compression thresholds using coaxial channel equations. Signals the breakout direction using volume-weighted momentum vectors, maximizing entry accuracy before expansion occurs.
Finally, we confirm order-book imbalance at our execution zone. Waiting for a candle to close is too slow. The Bulls & Bears Order Flow monitors raw executed transactions directly from CQG/Rithmic tick feeds, calculating volume pressure imbalances (VPI) against retail tape pace (POTI). This exposes hidden institutional absorption and retail tape pace exhaustion, giving you precise trade timing.
Replaces lagging chart indicators with microsecond order flow analytics. Tracks cumulative volume delta (CVD) and tape imbalances to confirm that institutional block buyers are absorbing seller inventory before entry.
Sleek, high-stress Interpretation designs. Zero repainting or delayed signals.
Full-feature access to AQS analytical ecosystem (LAR) for 3 days. Designed for initial tool familiarization. Limited to 1 User / 1 License. Non-renewable.
Approx. 120-minute online LIVE market analysis sessions available with active subscription of LAR. Access via MyAtlas. Select weekdays.
Approx. 120-minute in-person LIVE market analysis sessions available with active subscription of LAR. Access via MyAtlas. Select weekdays.
60-minute individual consult session with an AQS analyst. Active subscription of LAR required. Access via MyAtlas. Schedule subject to change.
Rather than flooding charts with trailing exponential bands, the Atlas indicator suite focuses on structural order-book queues and volume distributions. We provide intraday traders with Zero-Delay, clean visual tools designed for fast interpretation and execution under high-stress conditions.
All indicators support unlimited execution backing in **NinjaTrader 8 Test / Simulation Mode** for free. Live licensing is only required when routing real capital transactions. Contact support to request a Test License key.